2020-2021 Annual Report
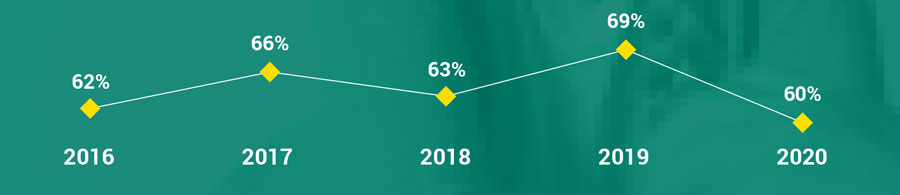
New Student Fall to Spring Persistence
Degrees & Certificates Awarded
2015-2016: 811
2016-2017: 729
2017-2018: 814
2018-2019: 788
2019-2020: 747
2020-2021: 728
14 : 1 Student-to-Faculty ratio
Outreach & Workforce Development
68.60 Workforce (CTE) Degrees per 100 FTE
1,240 Participants in customized training sessions
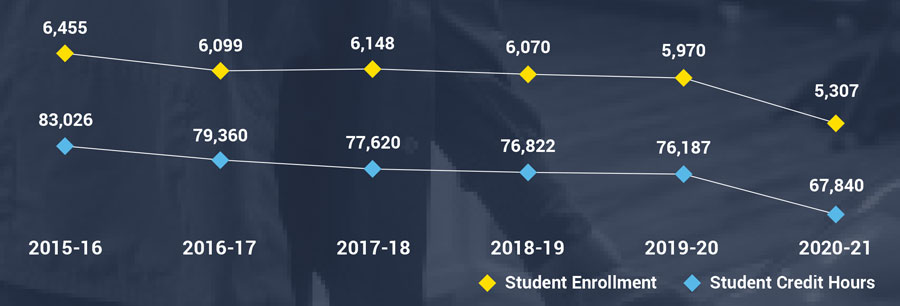
Annualized Enrollment
5,307 Unduplicated Credit
1,324 Unduplicated Non-Credit
2,451 Transfer
816 CTE
2,180 Non-Degree Seeking
Annual Enrollment Trends
From Where?
Laramie County: 3,264
Albany County: 819
Other Wyoming Counties: 546
Out-of-state: 653
International: 25
Student Age
Under 18: 1,598
18-24: 2,261
25+: 1,448
High School
Concurrent: 1,222
Dual/Jump: 418
Unduplicated: 1,502
Pathway Headcounts
Not all students are in a Pathway; a student can be in multiple Pathways.
New Student Pathway Headcounts |
2016 |
2017 |
2018 |
2019 |
2020 |
| Agriculture & Equine | 53 | 55 | 60 | 68 | 58 |
| Business & Accounting | 86 | 87 | 91 | 132 | 106 |
| Communication & Creative Arts | 60 | 63 | 72 | 54 | 48 |
| Human & Public Services | 184 | 182 | 192 | 217 | 156 |
| Health Sciences & Wellness | 217 | 262 | 250 | 291 | 263 |
| Information Technology | 21 | 31 | 28 | 25 | 10 |
| Science, Technology, Engineering & Math | 102 | 77 | 124 | 140 | 112 |
| Trades & Technical Studies | 102 | 94 | 108 | 133 | 63 |
| Totals | 1,181 | 982 | 1,023 | 1,056 | 948 |
Pathway Percent of Total New Students |
2016 |
2017 |
2018 |
2019 |
2020 |
| Agriculture & Equine | 4% | 6% | 6% | 6% | 7% |
| Business & Accounting | 7% | 9% | 9% | 12% | 13% |
| Communication & Creative Arts | 5% | 6% | 7% | 5% | 6% |
| Human & Public Services | 16% | 19% | 19% | 21% | 19% |
| Health Sciences & Wellness | 18% | 27% | 24% | 28% | 32% |
| Information Technology | 3% | 4% | 3% | 2% | 1% |
| Science, Technology, Engineering & Math | 9% | 8% | 12% | 13% | 14% |
| Trades & Technical Studies | 9% | 10% | 11% | 13% | 8% |
Financial Breakdown
Expenditures by Series
$44,131,533
Expenditures by Program
$45,159,953
Revenues
$47,350,103